
12 Times Marvel Characters Crossed Over Into the Real World
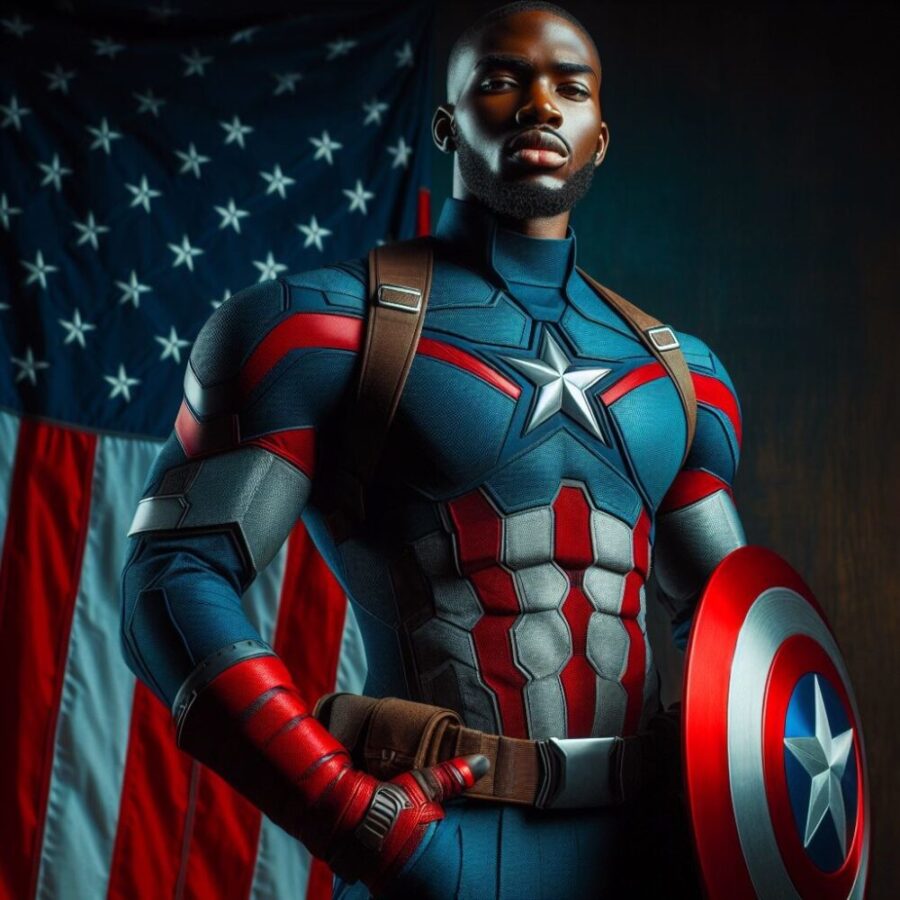
Comic books reflect the real world all of the time. The first Captain America comic book features Cap punching ...
11 Baby Boomer Tips For Recognizing and Fighting Workplace Ageism

Workplace ageism occurs when workers over the age of 40, and usually older, are discriminated against or pushed out ...
14 Lesser-Known Marvel Stories That Could Be the Next Big Hit
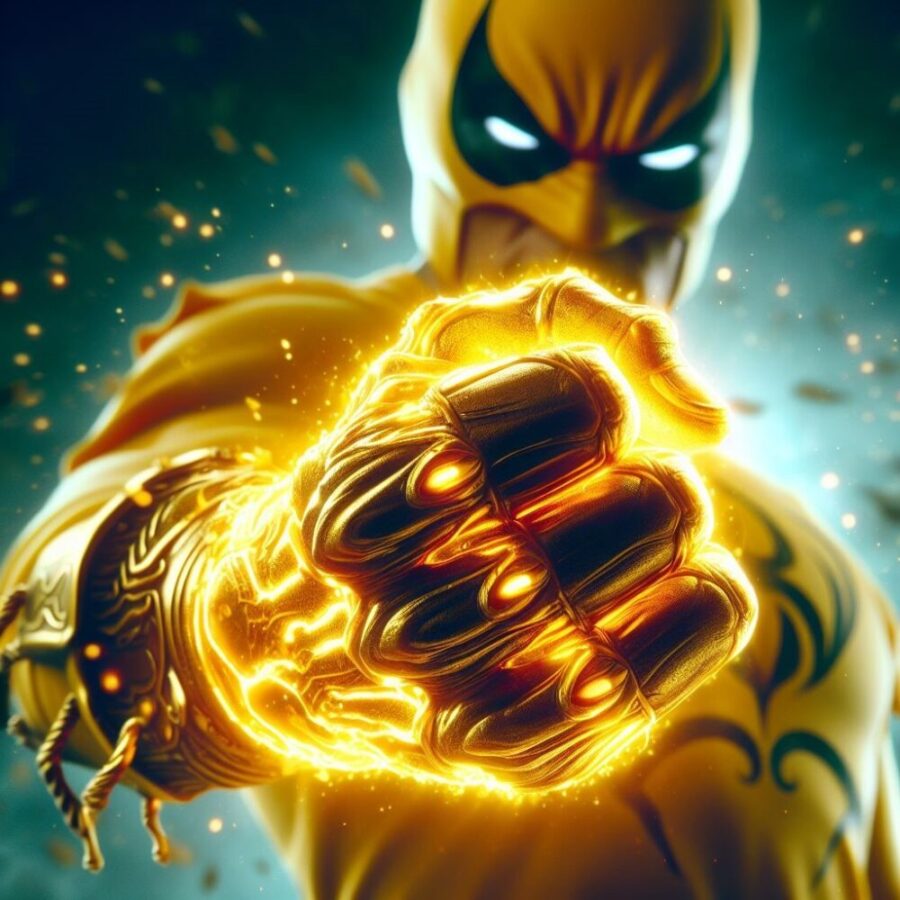
Marvel stories hit the collective fandom consciousness in electrifying ways when adapted for film properly. ...
10 Reasons Comic Book Fans Fell Out of Love With Spider-Man

No one denies that Spider-Man is wildly popular in cartoons, video games, and live film adaptations. Still, the ...
10 Cinematic Universe Attempts to Copy the MCU That Failed Miserably
From 2008 to 2023, the MCU generated over $29 billion in revenue. Even though the brand has underwhelmed and ...
Quiet Layoffs: Here Are The Real Reasons You’re Losing Your Job

In 2020 and 2021, the United States experienced the Great Resignation. Tens of millions of Americans voluntarily ...